IE code
Format
Est. dedication time
Academic Area
Type of publication
Awards received
- IE Multimedia Award 2005. Highest Rated Category
Description
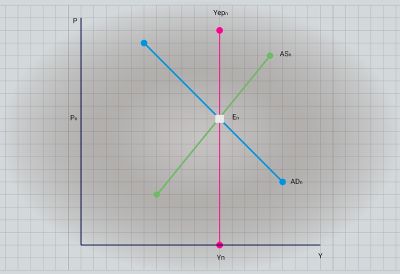
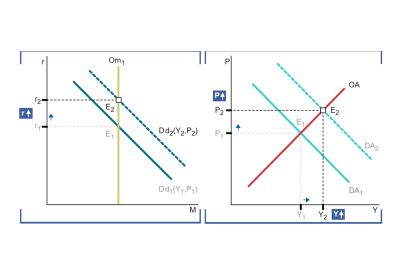
The purpose of this interactive material is to enable students to learn and comprehend the cause-effect relationship in the full aggregate demand and supply (AD/AS) model and to observe the adjustment of the economy in the short and the long term. The program assumes that students are already familiar with the underlying concepts of the graphic representation of the AD/AS model.
The tool also includes a number of simple case studies that illustrate the capacity and limits of the model and explain certain real economic situations.
Author's comments
This multiinteractive technical note forms part of a series of interactive graphs (EC08/197-M EC08/192-M EC08/194-M EC08/195-M) which have been designed to be used together in introductory economic courses. Each one of these graphs builds on the concepts taught in the previous ones and is an accumulative learning process. The last graph of the series (EC08/195-M) was awarded with the IE Multimedia Award in 2005 as the project that was most valued by students. Without doubt the key to success of these materials is the fact that both professors and students alike find them incredibly simple.