IE code
Format
Est. dedication time
Academic Area
Type of publication
Description
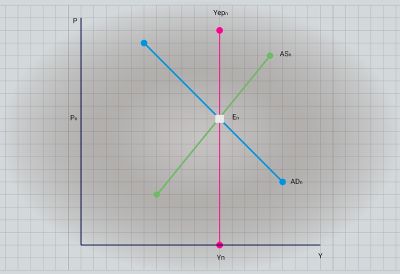
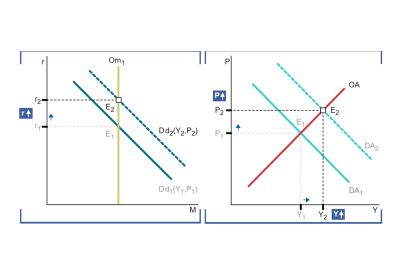
This interactive tutorial allows students to see the effect of changes in the economic variables that form part of aggregate demand. The purpose is to enable students to learn and comprehend the cause-effect relationship in the short term between the relevant economic variables. There are a number of interactive exercises that help students to understand how the aggregate demand curve works and answers can be checked against the graph.
Author's comments
This multimedia material forms part of a series of interactive graphs (EC08/197-M EC08/192-M EC08/194-M EC08/195-M) which have been designed to be used together in introductory economic courses. Each one of these graphs builds on the concepts taught in the previous ones and is an accumulative learning process. The last graph of the series (EC08/195-M) was awarded with the IE Multimedia Award in 2005 as the project that was most valued by students. Without doubt the key to success of these materials is the fact that both professors and students alike find them incredibly simple.