IE code
Format
Est. dedication time
Academic Area
Type of publication
Description
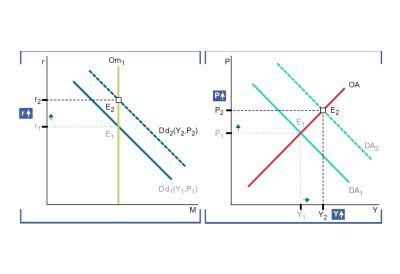
This is an interactive tutorial that allows students to see the effect of changes in monetary and fiscal aggregate demand policies on the adjustment of the goods and services and asset markets.
The tool assumes that students have already studied the concepts underlying the adjustment processes of the goods and services market and the asset market. For a better understanding of the main effects of monetary and fiscal policies on the overall adjustment of both markets this graphic resource does not envisage simultaneous execution of both policies nor their effects on capital movements and exchange rates. The tool also contains some simple exercises that enable students to contrast their answers by using the interactive graph.
Author's comments
This multimedia material forms part of a series of interactive graphs (EC08/197-M EC08/192-M EC08/194-M EC08/195-M) which have been designed to be used together in introductory economic courses. Each one of these graphs builds on the concepts taught in the previous ones and is an accumulative learning process. The last graph of the series (EC08/195-M) was awarded with the IE Multimedia Award in 2005 as the project that was most valued by students. Without doubt the key to success of these materials is the fact that both professors and students alike find them incredibly simple.